Operations reporting
KPI and Support Load Reporting
Reporting automation that turned support-platform, telephony, spreadsheet, and Slack-shaped data into repeatable management visibility.
Problem
Leadership needed repeatable visibility into support activity and workload without manually rebuilding reports from disconnected tools. The reporting needed to preserve the details that matter before summarizing them into management-friendly output.
Work
- Built KPI reporting patterns across support platform, telephony, spreadsheet/history, and Slack-shaped delivery surfaces.
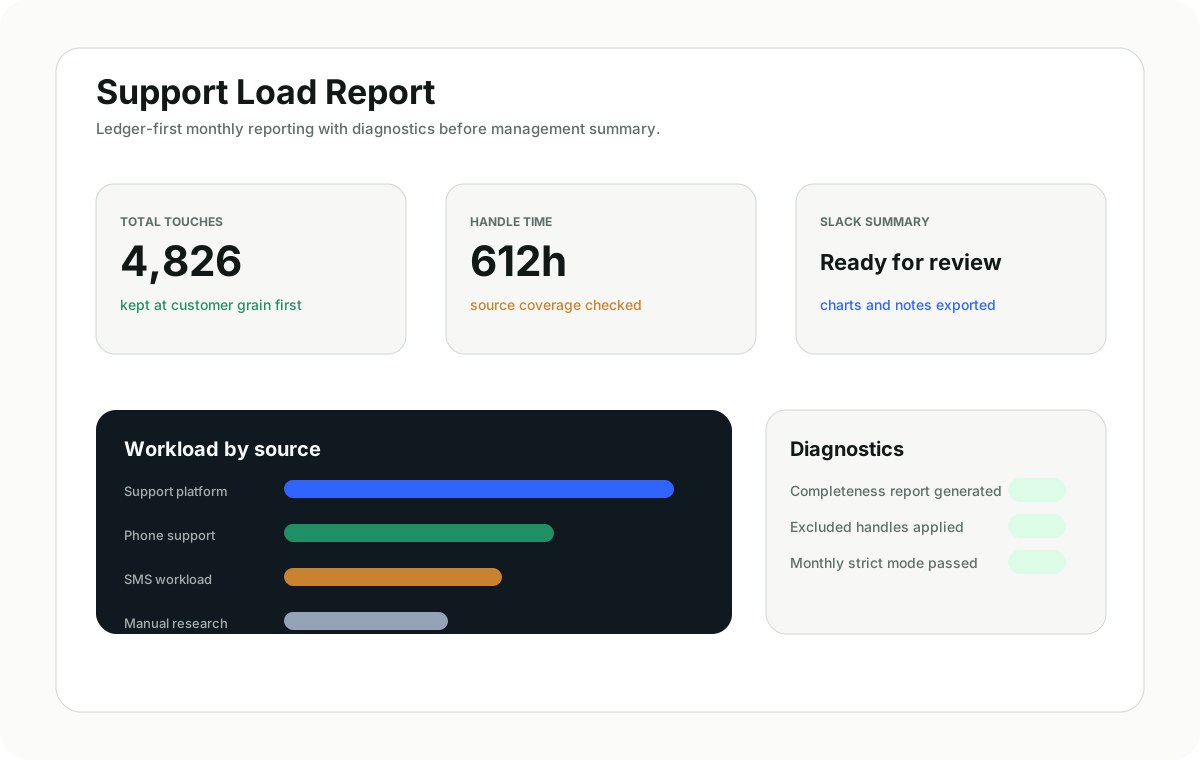
- Modeled support workload as a repeatable reporting pipeline with ledgers, rollups, diagnostics, chart artifacts, and monthly reports.
- Produced documentation and templates so the reporting shape could be maintained and extended.
Outcome
Ambiguous operational activity became a repeatable reporting system that made workload and role KPI visibility easier to discuss, audit, and improve.
Build story
From operational mess to trustworthy system.
Disconnected activity
Support, telephony, spreadsheet history, and Slack-shaped reporting each describe only part of the workload.
Ledger first
Customer-level and source-level detail has to be preserved before monthly averages are summarized.
Management view
Reports need enough diagnostics to support staffing and workload conversations.
What shipped
- Repeatable reporting pipeline with ledgers, rollups, diagnostics, chart artifacts, and monthly reports
- KPI reporting patterns across support platform, telephony, spreadsheet/history, and Slack-shaped outputs
- Templates and documentation for maintaining and extending the reporting shape
- Completeness checks that make missing source data visible before reporting
Guardrails
- Ledger-first reasoning before averages or summaries
- Strict diagnostics for missing monthly inputs
- Known non-operational handles and source coverage issues kept explicit
Proof artifacts
- Sanitized monthly report visual showing workload, diagnostics, and summary readiness
- Chart artifacts and report templates
- Diagnostics that separate source coverage from management interpretation
Outcome
- Leadership gets repeatable management visibility instead of one-off spreadsheet reconstruction
- Support workload can be discussed with source context intact
- The reporting system is easier to audit and improve over time